


Speeding Up Slow Queries: A Real-World Case Study
How I Cut Query Time from 30+ Seconds to Just 2-3 Seconds: A Step-by-Step Optimization Journey

As backend developers, one of the most critical skills you need to develop is the ability to optimize SQL queries. Optimizing queries doesn’t just involve rewriting them, it also means understanding how the database engine processes the queries.
The Challenge
In one of my projects, a report query that joined the orders, products, and customers tables took over 30 seconds to run. The query involved aggregating large datasets and sorting the results by order count—something that became painfully slow as the data grew.
Here’s the original query:

What Should I Check: Understanding How Things Really Happen
A query plan is like a roadmap the database query optimizer generates to figure out how to execute a SQL query. It outlines the steps the database takes to retrieve, filter, and aggregate data. Understanding this plan is crucial for spotting inefficiencies that could cause performance issues.
Key Components of a Query Plan to Check:
Scan Type
This describes how the database searches for data. The most common types are:Sequential Scan: The database scans the entire table row by row.
Index Scan: The database uses an index to quickly find relevant rows.
Join Type
This defines how the database joins tables. Common join methods include:Nested Loops: Suitable for small datasets, iterating through rows.
Hash Join: Used for large datasets, hashing one table to efficiently find matching rows in another.
Cost
The cost represents the estimated computational effort to execute a query. It helps the optimizer choose the most efficient path for query execution. A higher cost usually indicates a less efficient plan.Rows
This shows the estimated number of rows that will be processed at each stage of the query. It helps in evaluating whether the optimizer’s estimates are accurate and if there’s room for improvement.Filters
Filters show the operations the database performs on the data, such as sorting, grouping, or applying conditions. Understanding how and when these operations occur can highlight areas where optimizations might be necessary.

The Deep Dive: Using EXPLAIN ANALYZE
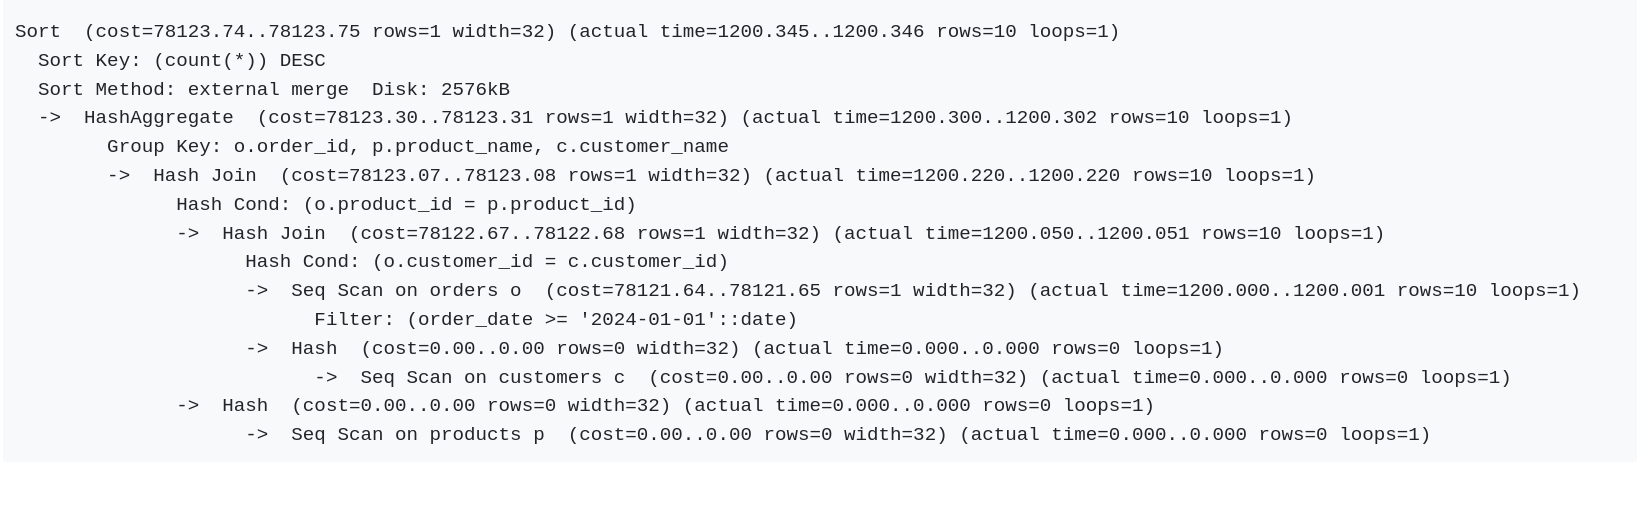
To understand why the query was so slow, I ran EXPLAIN ANALYZE to see the execution plan. The results showed that PostgreSQL was doing full table scans on both the orders and customers tables. This meant that even though we had a date filter on orders, it wasn't being used effectively to limit the dataset before the joins.
The query was also doing costly hash joins and external sorting, which added more overhead.
The Optimization Process
Step 1: Indexing the Right Columns
The first thing I did was add indexes on the columns involved in filtering and joining. I created a composite index on the orders table for order_date, customer_id, and product_id, which allowed PostgreSQL to efficiently filter and join the tables.
CREATE INDEX idx_orders_date_customer_product ON orders(order_date, customer_id, product_id);
Additionally, I added indexes to the customer_id in customers and product_id in products.
CREATE INDEX idx_customers_customer_id ON customers(customer_id);
CREATE INDEX idx_products_product_id ON products(product_id);
Step 2: Materializing the Data
Instead of running the same complex query repeatedly, I decided to create a materialized view to precompute the results. This drastically reduced the query time because it avoided repetitive aggregation and sorting.

The result was like :
Let us take it the amazing tool : https://www.pgexplain.dev/

Step 3: Partitioning the orders Table
Given that the orders table had millions of rows, I partitioned it by order_date. This allowed PostgreSQL to scan only the relevant partitions when querying data for the specific date range.
CREATE TABLE orders_2024 PARTITION OF orders FOR VALUES FROM ('2024-01-01') TO ('2024-12-31');
Step 4: Parallel Query Execution
To fully leverage the power of modern hardware, I enabled parallel query execution. This split the work across multiple CPU cores, reducing the processing time.
SET max_parallel_workers_per_gather = 4;
The Result
After applying these optimizations, the query that once took 30+ seconds to run now completes in just 2-3 seconds, even with millions of rows. The improvements were clear:
Indexes sped up filtering and joining.
Materialized views precomputed the result, saving time on repeated queries.
Partitioning ensured that only relevant data was scanned.
Parallel execution boosted processing speed across multiple cores.
Ready to take your database optimization skills to the next level? Unlock expert techniques with 'Mastering Database Optimization' for just $7 USD! Don't miss out—get your copy now and start optimizing like a pro! Get your copy here.